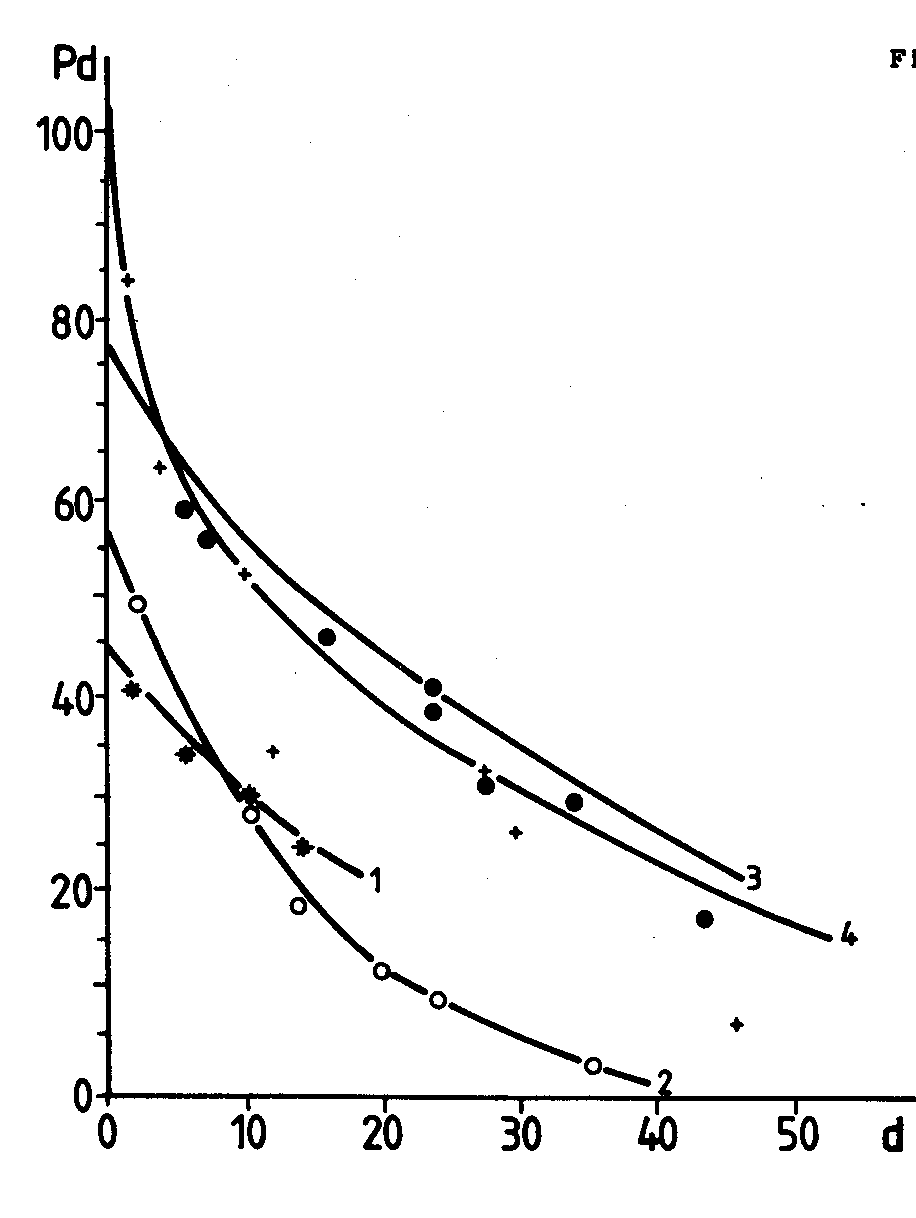

| Fig VII-2. | Example of the estimation of the decrease rate of the number of autochtonous, marked beetles in a pool (Wn) |
| d = | number of days after release |
| pd = | minimum number of beetles present at d days after release, according to the curve number of marked beetles at least present: |
| * = | in period 1 |
| o = | in period 2 |
| in period 3 | |
| + = | in period 4 |
return to your last point in text by using the ![]() [previous] in the left upper corner of your browser
[previous] in the left upper corner of your browser