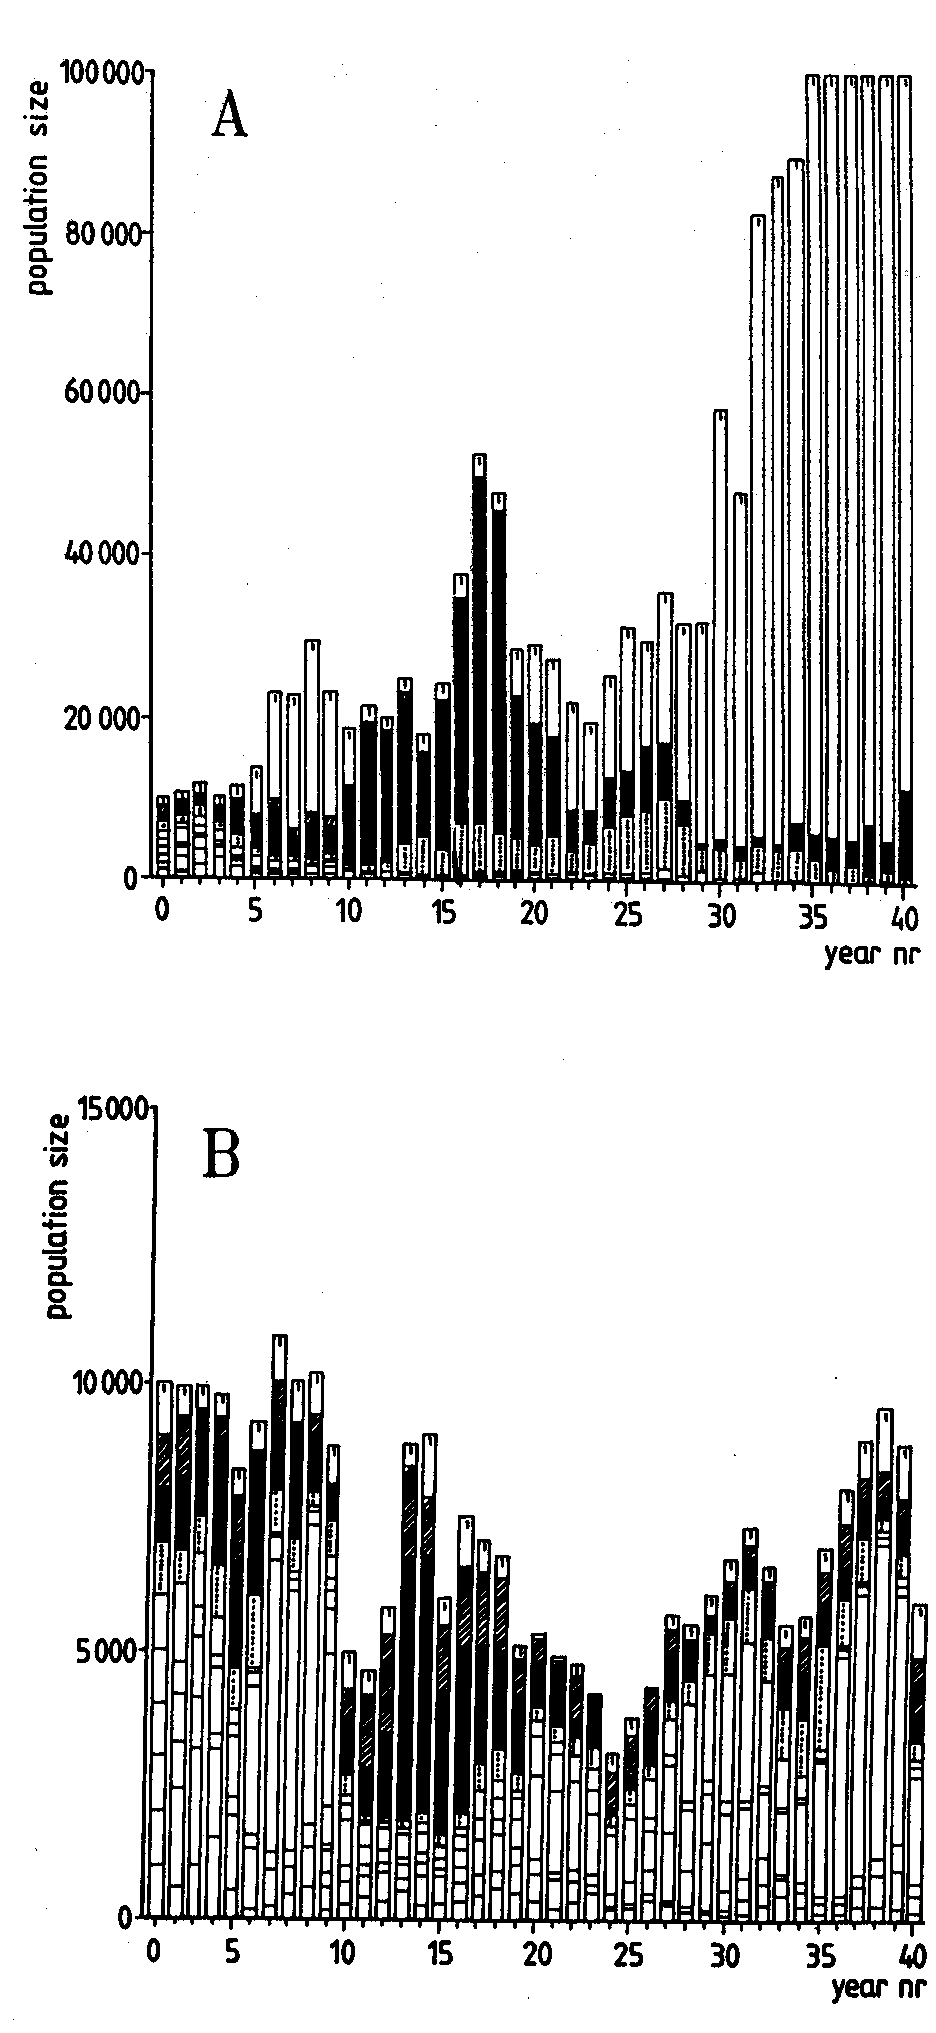

| Fig VIII-5. | Simulation of Gyrinus field data Summed population size in 10 habitats during 40 years |
| A: | without flight activity |
| B: | with flight activity |
| scale Y-axis A = 6.67 x scale Y-axis B Each bar fraction corresponds with one population |
| A: without flight activity |
| see B: with flight activity |
| B: with flight activity |
| see A: without flight activity |
return to your last point in text by using the ![]() [previous] in the left upper corner of your browser
[previous] in the left upper corner of your browser