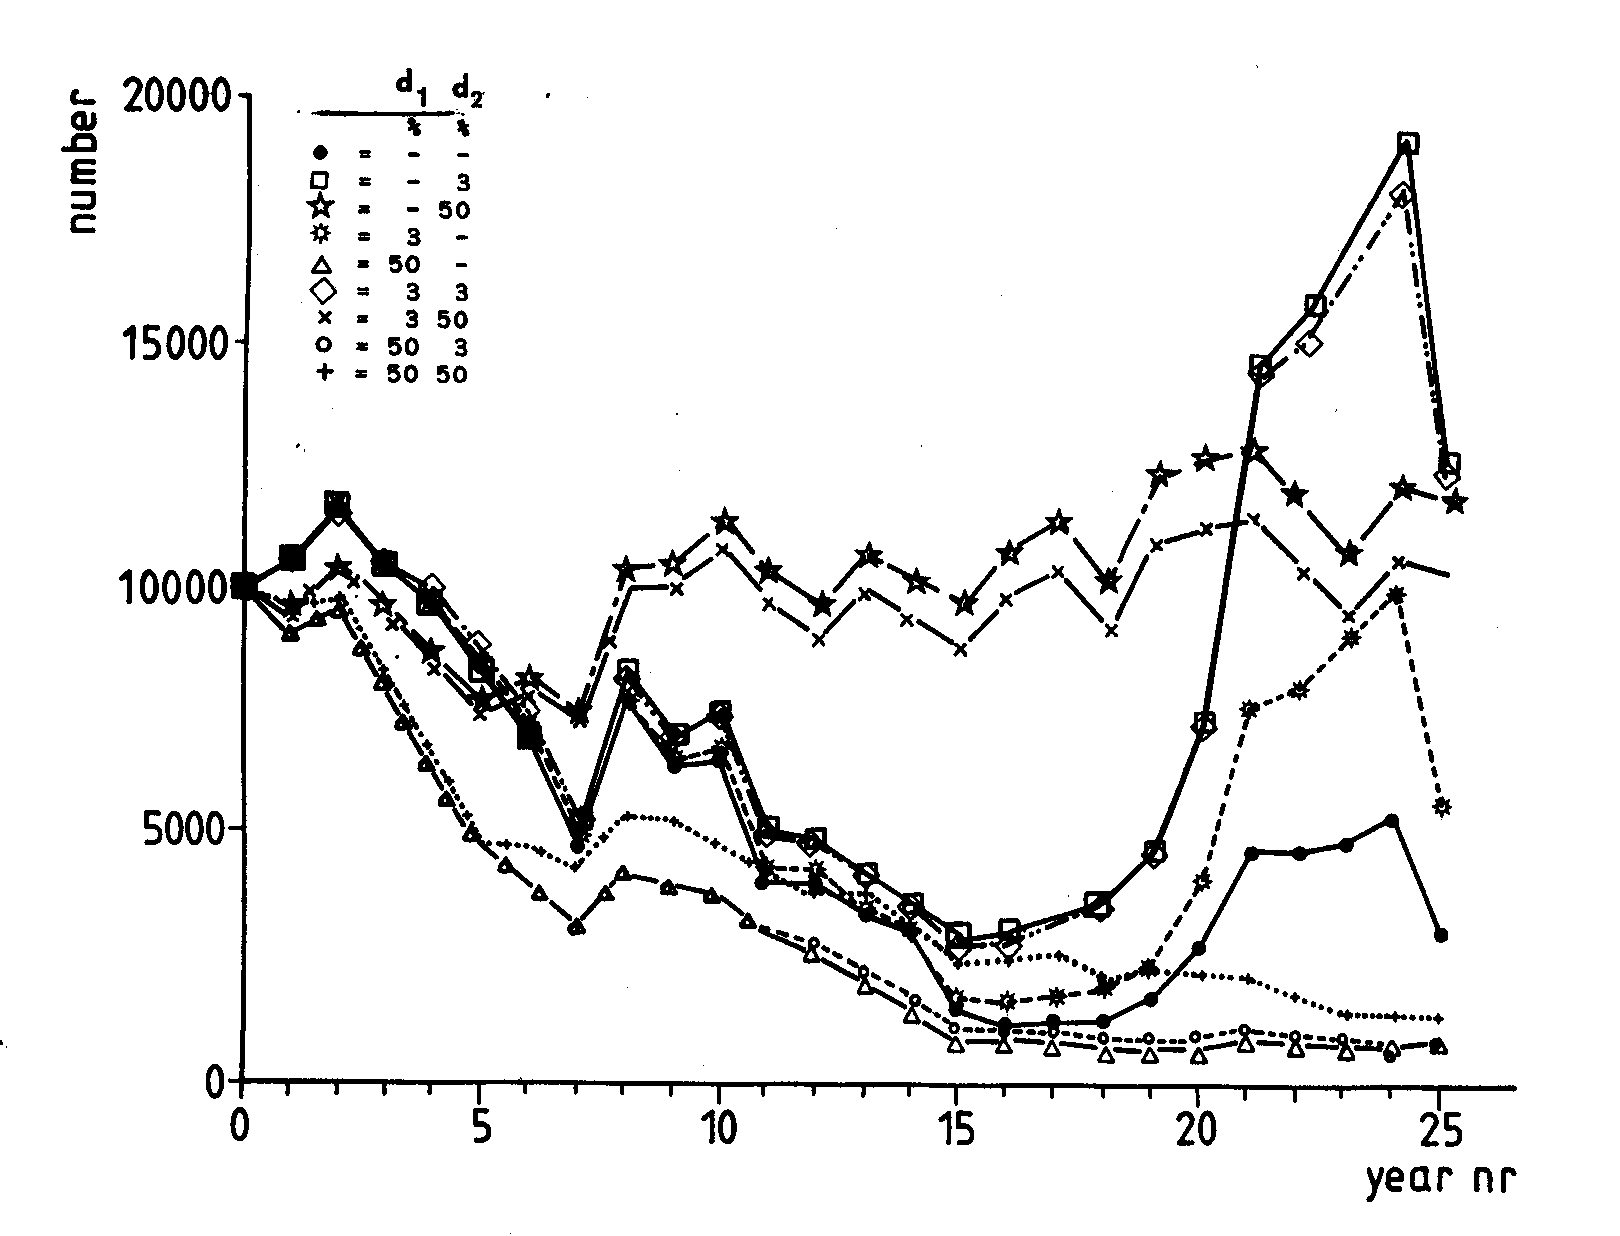
| Fig VIII-4. | Fluctuations of population size during 25 years summed over 20 habitats under different dispersal conditions as described in Table 4a. The numbers along the curve without any dispersal (B) show the number of populations still surviving. In all other cases all 20 populations were present each year. |
| d1, d2 = | percentage of emigrating individuals in first and in the second generation respectively |
