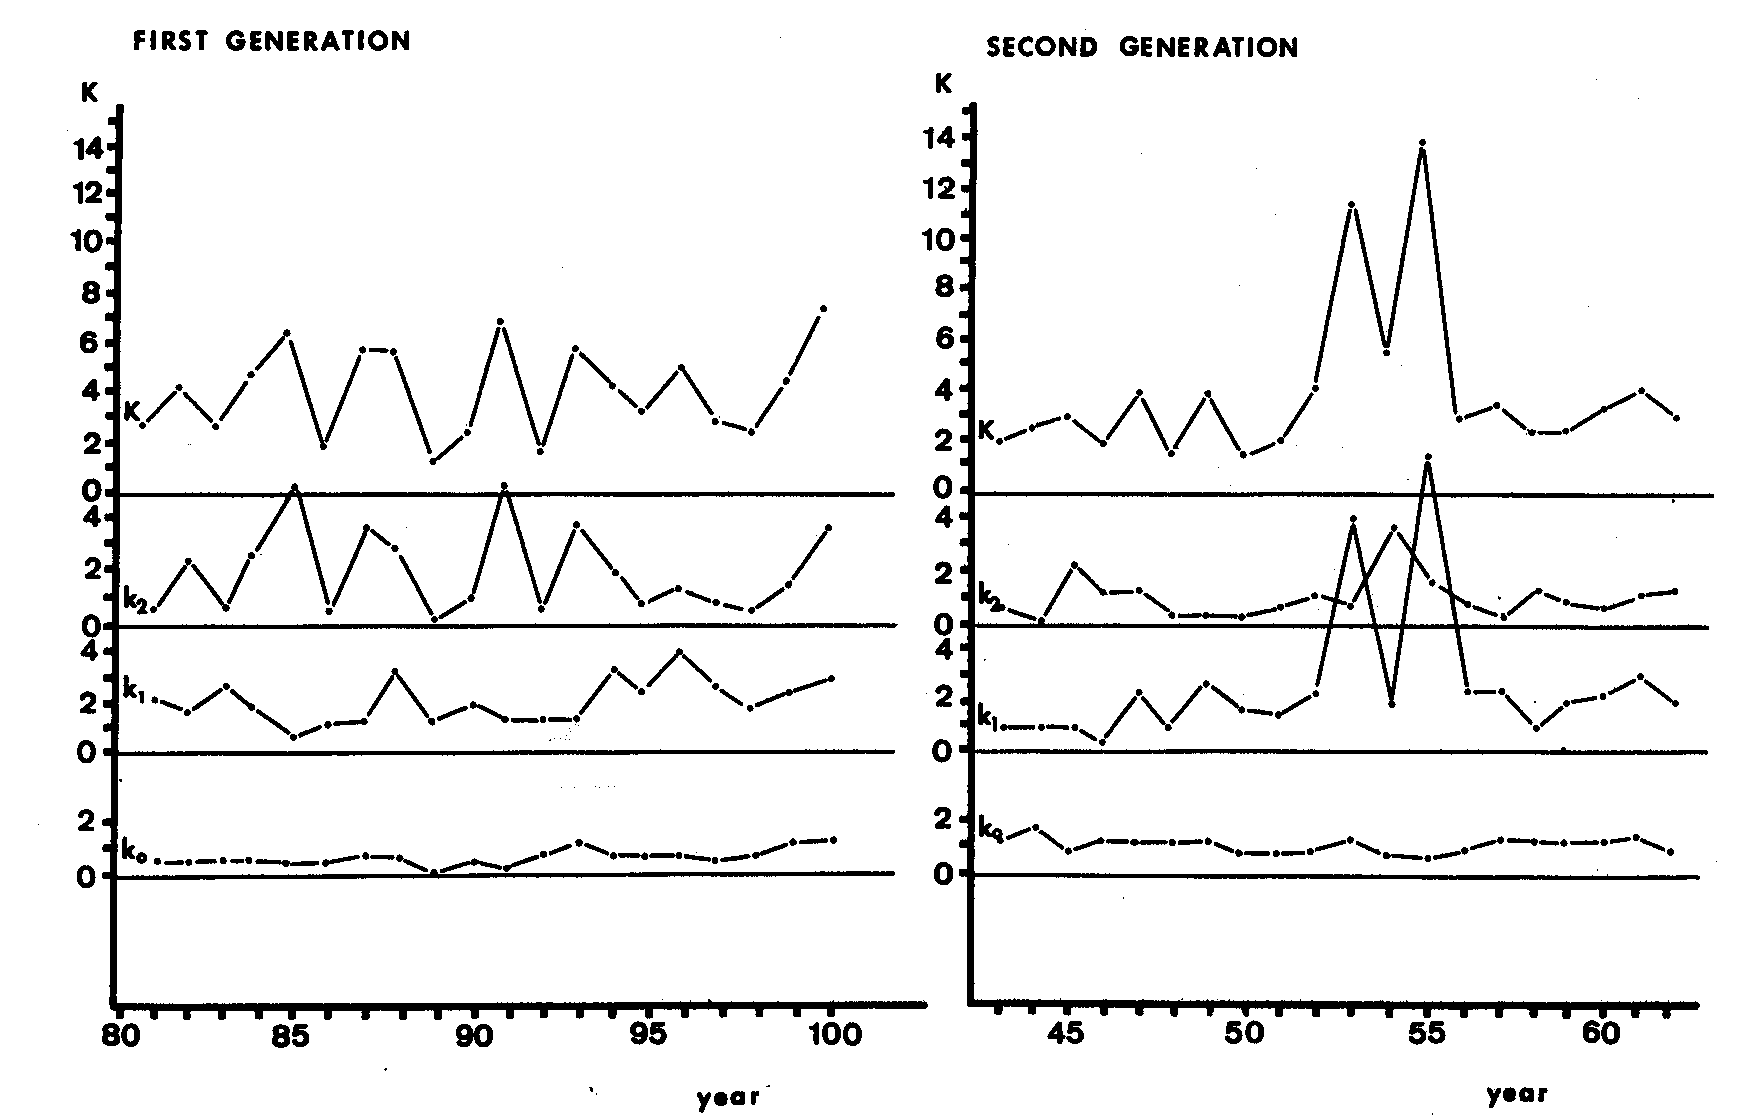
| Fig. IV-5. | Key-factor analysis of a simulated reproduction process over 100 generations |
| The picture shows as an example the output of k-values during 20 years from both reproducing generations separately | |
| k0 = | egg production |
| k1 = | viability of eggs |
| k2 = | larval + pupal development |
