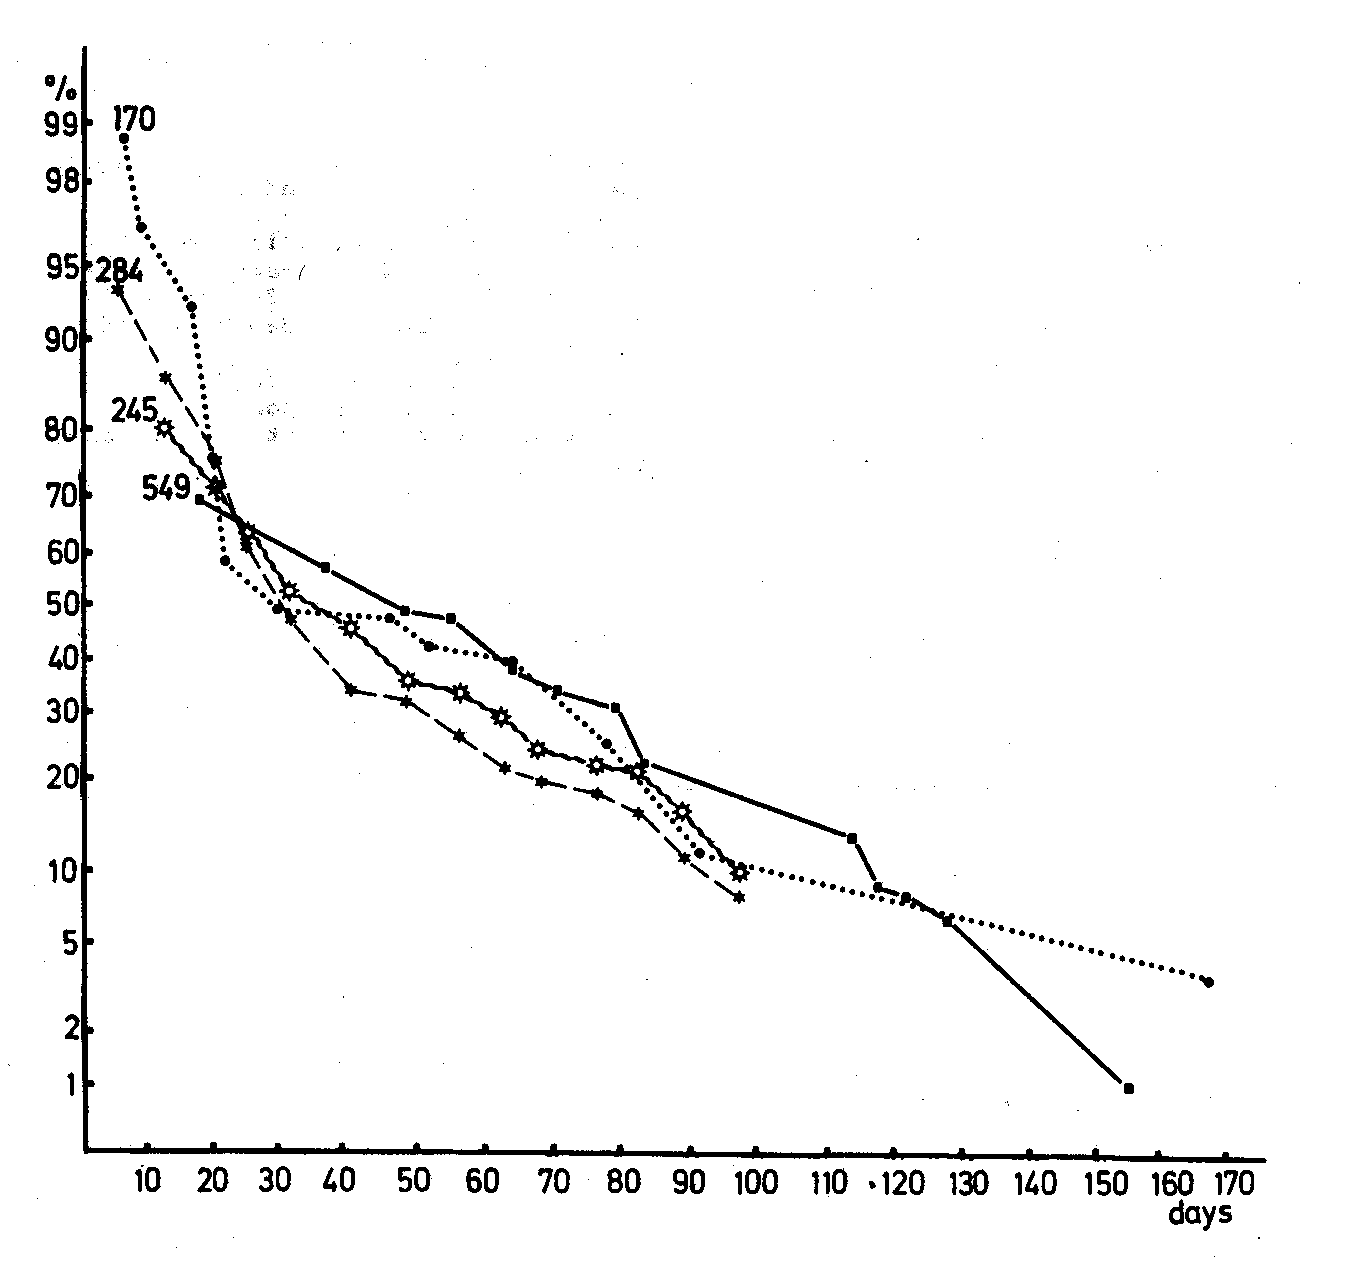

| Fig VI-4. | Decrease rates of three isolated populations in different years The marked beetles were released for the first time on April 28 (A), July 5 (B) and September 14 (C, females only) Y-axis: minimum percentage of beetles present in the population x days after first release(probit scale, see Southwood 1978) X-axis: number of days after first release |
| Sns; isolated ditch, clip-winged part of the population (1977) | |
| SnS; isolated ditch, full-winged part of the population (1977) | |
| SpG; pool outside the study area (1969) |
| Zp; isolated pool in the study area |